Improvement on Data Range Classification
The fourth panel on the Navigator Bar focuses on classifying the information of your image document. The number of selected tools determines the number of data classifications. For example, if you have selected a total of 4 tools, the information retrieved from your image document is classified into 5 ranges of data. The 4 groups will represent the selected tools. The last group will represent to the area where there will be no pattern at all. This group is made optionally on the 4th version, where the user are capable to eliminate it or even make the range of this group larger than other any group. The illustration of the Data Range Classification panel on the Navigator Bar can be seen as below.
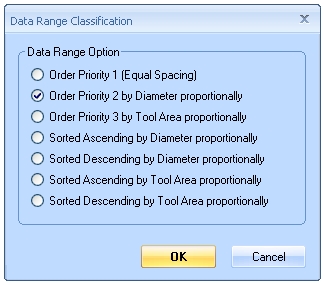
On this 4th panel, there are two buttons which has specific purposes in classify the image data. When the first button is clicked, it will show a dialog box where a user can select the way the data range is classified. There are currently 7 options to define the data range. The first 3 options is where the data is classified by the order priority. The first one is where the data has an equal proportional division one to another. The second and the third is where the division of the data range is defined by the diameter and the Area of the tool consequently. The rest of the option is where all the data is sorted either based on the diameter or based on the Tool Area, either sorted ascending or sorted descending.
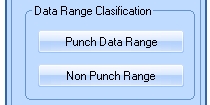
The second button is a new feature added on the 4th version onward. When a user click this button, a dialog box will be displayed. This dialog enables the user to determine the data range of the non punch area. As a default, the data range of this area will be arranged based on the total selected tool. For example, if the total tool to be used to generate the perforated pattern is 5, the percentages of the non punch area by default will be 100/(5+1) percentages. If a user will select -100%, the non punch area will be eliminated. If the user select +100% or 200%. This means that the non punch area will be enlarge by adding 100% or 200% of the current value.
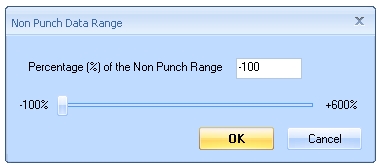
The illustration below will describe the Non punch Data Range feature. As we can see on below illustration, when the Non Punch Data range is set as default, we can clearly see the area around the corner of the sheet is black, which means that area is a non punch tool. However, when we setup the value up to +500, the non punch area becoming larger. On the other hand, when we setup the value to be -100, All the non punch tool area disappears, as every grid in the sheet has been filled by the tools. The selection or decision to change the value of the non punch area solely depends on the user’s desired and design.
The pattern result illustrated below is when the Non Punch Data Range is setup as default.

The pattern result illustrated below is when the Non Punch Data Range is setup as +500%
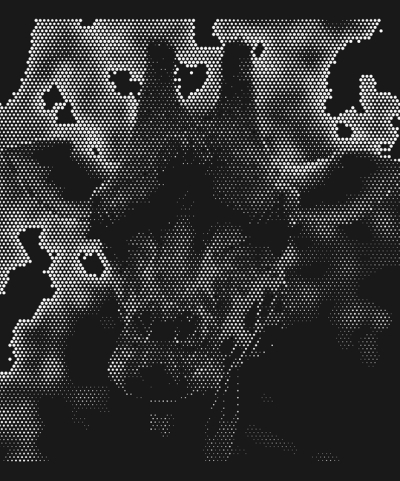
The pattern result illustrated below is when the Non Punch Data Range is setup as -100%
